
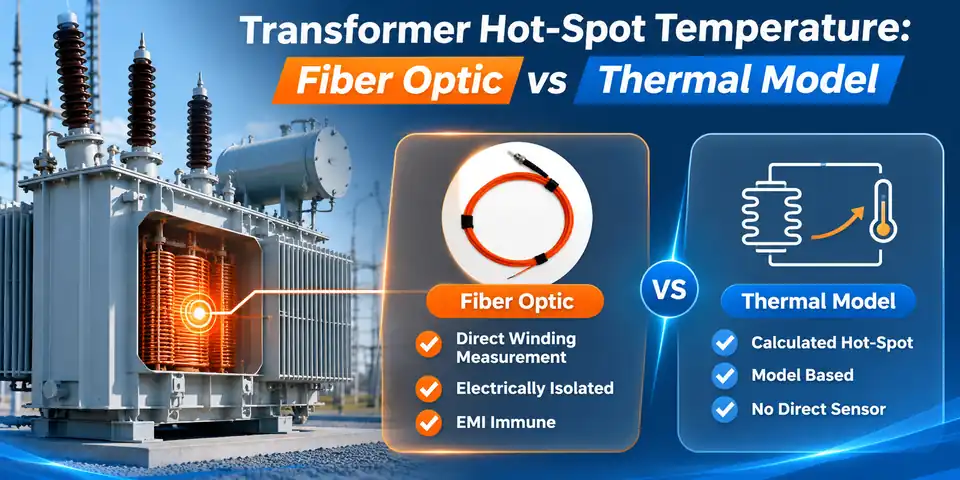
Thermal models calculate a winding hot-spot temperature from load, oil temperature, ambient conditions and thermal parameters. Embedded fiber optic probes report temperature at the winding locations where they were installed. One output is a computed thermal state, the other a measurement at a defined point, and each has to be read with that difference in mind.
- Hot-spot temperature is a local winding value. Top-oil temperature and average winding temperature describe other quantities and read lower.
- Model estimation can provide a continuous hot-spot estimate when the required load, temperature inputs and thermal-model parameters are available.
- Embedded probes measure temperature at selected winding points, and each added probe adds a point.
- Probe placement sets the meaning of a reading, because a probe measures only where it sits.
- In one reported field evaluation (a 100 MVA ONAF unit, five-day window), an IEC-style baseline ran 8.47 °C above the fiber reference on average. That result belongs to that unit and those operating conditions.
- Measurements can validate and refine thermal models, while models provide an estimated thermal state beyond the instrumented points.
Transformer Hot-Spot Temperature Guide
- What Counts as Hot-Spot Temperature
- How Thermal Models Estimate Hot-Spot Temperature
- What an Embedded Fiber Optic Probe Measures
- Direct Measurement vs Model Estimation
- Why Probe Placement Changes the Meaning of a Reading
- Field Evidence: Fiber Reference vs Thermal Model
- Using Measurements and Models Together
- INNO Configuration for Direct Winding Measurement
- Transformer Hot-Spot Measurement FAQ
- References
What Counts as Hot-Spot Temperature?
Hot-spot temperature is the highest temperature reached inside the winding, and it drives how fast the paper insulation ages [2]. Heat generation and cooling are uneven across a winding, so one conductor region runs hotter than the rest, while top-oil temperature, taken in the oil at a defined location, reads lower. IEC 60076-7 frames loading guidance for mineral-oil-immersed transformers around operating temperature and thermal ageing [1], which is why the local peak gets so much attention. Causes and likely locations are covered in what causes hot spots in transformers and how they are monitored. This guide deals with how the number is obtained.
| Quantity | What it describes | How it is obtained | Reading it correctly |
|---|---|---|---|
| Top-oil temperature | Oil at a defined upper location | Sensor or indicator in the oil | Not a conductor temperature. Its offset from the hot spot varies with unit and load. |
| Average winding temperature | Mean conductor temperature | Resistance method during testing | Smooths out local peaks. |
| Calculated hot-spot temperature | Modeled thermal state of the winding peak | Thermal model driven by load, oil temperature, ambient and parameters | Valid as far as parameters and inputs represent this transformer. |
| Embedded probe reading | Temperature at one installed point | Fluorescence fiber optic probe in the winding | Matches the winding peak only when the probe sits at or near it. |
How Thermal Models Estimate Hot-Spot Temperature
Thermal models build the hot-spot figure in layers. Ambient temperature sets the baseline. Top-oil rise above ambient follows load over hours, and the winding hot-spot gradient above the oil responds faster [2]. Time constants, exponents and rated rises come from type tests or standard values, and a cooling-stage change switches the parameter set. IEC 60076-7:2018 carries thermal models of this kind in a generally applicable mathematical form [1].
Models have clear engineering value. They run wherever load, oil-temperature and parameter data are available, including units with no embedded probes, which covers most installed oil-immersed transformers because fitting probes inside a finished winding is difficult. They support loading and overload assessment, give a continuous figure between measurements, and scale to fleet monitoring.
A model reproduces the transformer its parameters describe. Where operation departs from that description, the departure shows up as residual error. The 2026 field study discussed below notes that estimates built on nameplate parameters or standard temperature-rise curves can be biased during abrupt load changes, cooling-state transitions and localized loss concentration [2]. That statement describes where a unit-specific check earns its place. It does not make thermal models unreliable.
What an Embedded Fiber Optic Probe Measures
An embedded fluorescence probe reports the temperature at its sensing tip. Excitation light travels down the fiber to a fluorescent material, the fluorescence decays after excitation, and the decay behavior changes with temperature. A compatible instrument evaluates the decay and converts it to a temperature for that single point (see direct hot-spot monitoring and the fluorescence sensing principle).
Inside a winding, the sensing path is optical, so there is no metallic signal wiring at the measurement point. INNO lists a 100 kV high-voltage resistance for its oil-immersed winding probe. Electrical isolation, immunity to electromagnetic interference along the optical path and the ability to sit inside the winding structure are the reasons fiber optic probes are chosen for these locations. Accuracy ratings matter less to the hot-spot question than where the tip sits, so this guide does not rank probes against PT100 sensors on accuracy.
One probe is one point. More probes on separate channels give more points, which is how the number of winding temperature sensors grows with phases, windings and heights of interest.
Direct Measurement vs Model Estimation
| Aspect | Thermal-model estimate | Embedded fiber optic probe |
|---|---|---|
| Measurement basis | Calculated from load, oil temperature, ambient and parameters | Optical response of a sensing tip at a physical point |
| Output | Estimated hot-spot state | Measured temperature at the installed location |
| Spatial meaning | An equivalent hot spot as the model represents it | One defined conductor location per probe |
| Sensor location | None inside the winding | Chosen during design, installed during manufacture |
| Dependence on probe placement | None | Direct. The reading means what the location means. |
| Response to operating conditions | Follows modeled behavior. Unmodeled effects appear as residuals. | Records what happens at the point, including effects no model includes |
| Use in monitoring | Continuous estimate, loading assessment, units without probes | Multi-point measured data for display, alarms and trending |
| Role in validation | Object being checked | Reference for checking |
| Installation stage | Software and data connections | Planned during winding design and assembly |
Neither column replaces the other. The comparison with a winding temperature indicator, which is itself a model-based instrument, is treated in WTI and direct fiber optic measurement, and the full list of methods is in how transformer winding temperature is measured.
Why Probe Placement Changes the Meaning of a Reading
A probe measures where it is installed. Whether that location is near the winding peak depends on the design chain behind it:
Winding geometry → cooling and oil flow → expected hot-spot region → probe placement → local measured temperature → thermal model comparison.
Disc, layer or foil construction, cooling ducts and oil flow direction shape where heat accumulates, and the designer's thermal calculation turns that into expected hot-spot regions. Probes go into those regions during manufacture. The reading is then a direct local measurement of a thermally critical winding region. How close it comes to the absolute winding peak depends on how well the region was identified and how many points were instrumented. Positions are never copied from one design to another, as laid out in where temperature sensors are placed in transformer windings.
Comparisons with a model carry the same caution. When a probe reads below the model estimate, the model may overstate the temperature, the probe may sit away from the hottest conductor, or both. A probe also represents a discrete conductor location, while a model state usually represents an equivalent lumped hot spot, so some difference between the two is expected even when both are sound. Several independent points narrow the ambiguity by showing how much the temperature varies across the instrumented region. IEC 60076-7:2018 reflects the same concern on the test side, with a recommendation on the number of fibre optic sensors for the temperature rise test [1].
Field Evidence: Fiber Reference vs Thermal Model
A 2026 field study published in Discover Artificial Intelligence (Cao, 2026) compared thermal-model estimates with fiber optic winding measurements at a 220/500 kV substation that collects wind and photovoltaic power [2]. The winding test target was T2, the 100 MVA, 220 kV ONAF step-up transformer for the photovoltaic plant. Preinstalled fiber optic probes supplied the winding reference. Power-quality analyzers on the 35 kV collector side and SCADA supplied current harmonics, cooling status and ambient data. Temperatures were sampled every 5 minutes over 15 consecutive summer days. The first 10 days set up the models, and the final five days (1,440 samples) were evaluated.
Operating conditions were demanding for any thermal model. T2 load rose quickly after sunrise and fell in the evening, with load factor mostly between 0.48 and 0.91 p.u. Collector-side current distortion ranged mainly from 18% to 43.8% THD, and the hot-spot peak trailed the load peak by 30 to 60 minutes.
For the comparison, the winding reference at each timestamp was the highest valid reading among the available fiber channels. Each probe still represented a discrete conductor location, while the thermal-model state represented an equivalent lumped hot spot. That spatial mismatch contributes to the residual. The study also notes that probe coordinates and instrument calibration details were not part of the disclosed record, which limits how much of the gap can be traced to probe placement.
| Method | MAE (°C) | RMSE (°C) | R² |
|---|---|---|---|
| IEC dynamic thermal model (author's baseline) | 8.35 | 9.87 | – |
| Spectrum-aware physical model (adds harmonic-loss weighting) | 4.18 | – | – |
| Physics-data hybrid (physical model plus residual correction) | 1.87 | 2.34 | 0.972 |
What the numbers show
The fiber reference averaged 76.69 °C over the evaluation days. The IEC-based baseline averaged 85.16 °C, which is 8.47 °C higher, and it produced additional sustained high-temperature alarms because of that positive bias. Adding harmonic-loss weighting to the physical model cut MAE to 4.18 °C, and the hybrid with residual correction reached 1.87 °C. At the station's 98 °C warning threshold, the hybrid identified 12 of the 13 fiber-recorded exceedances [2].
What they do not show
These figures say nothing about the accuracy of IEC 60076-7 models in general. The baseline was the author's implementation, run on one unit, in one summer period, under photovoltaic-driven load swings with heavy current distortion. For this unit and operating window, the gap was large. A transformer with steadier load and cleaner current may show a different one. Elsewhere in the literature, Abdali and colleagues used optical fiber sensors during a temperature rise test on a 500 kVA distribution transformer and reported a purpose-built hot-spot formula tracking the measurements to 0.3 °C RMSE [3]. Model quality follows how well a model represents the specific unit, and measurement is how that gets checked.
The best-performing hybrid also ran on fiber data: the fiber reading from the preceding step fed its bias and parameter updates [2]. The study therefore shows measurement and model working together. Its own limits are stated plainly: one substation, one 15-day summer period, 13 above-threshold samples, and a rolling evaluation that differs from a frozen holdout. Local oil flow, phase-to-phase variation and discrete fiber placement are listed among the effects that widen the field residual, and the number and position of probes in the T2 winding are not given.
Using Measurements and Models Together
Hot-spot work runs better as a loop than as a choice. Thermal design and calculation identify expected hot-spot regions. Probes go into those regions during manufacture. The temperature rise test provides the first measured comparison. In service, probe data are compared with model output under real load, cooling and ambient conditions. Persistent divergence under one particular condition points to a short list of suspects: model parameters, cooling-state inputs, harmonic content, probe location or the instrument chain. Findings go back into the model, and the probes keep checking it.
Published work follows the same pattern. González-Cagigal and co-authors estimated states and parameters of a hot-spot thermal model jointly with an unscented Kalman filter, describing the procedure as aimed mainly at factory testing and usable in the field where the needed temperature measurements exist [5]. Abdali and colleagues validated a nonuniform magnetic-thermal model of a distribution transformer with optical fiber sensors and thermography [4].
Where a unit has no embedded probes, the model remains the available tool. Where probes exist, their readings do not depend on the thermal-model parameters used for hot-spot estimation, which suits alarms and trending at the instrumented points. Sensor characteristics, instrument uncertainty and placement still apply. Model output supplies an estimated thermal state beyond those points and supports loading decisions. The wider transformer temperature monitoring page shows how these pieces fit together on a project.
INNO Configuration for Direct Winding Measurement
For oil-immersed transformers, INNO's current catalog covers the measurement chain in three parts. Figures are as listed on each product page.
- Oil-Immersed Transformer Winding Fiber Optic Temperature Sensor. Passive fluorescence probe with polyimide fiber and PTFE sheath. Listed range -40 to +260 °C, 0.1 °C resolution, ±1 °C accuracy, 100 kV high-voltage resistance, standard 3 m length with custom lengths available. It is the sensing element only and needs a compatible host and any tank-boundary components. Tip location and fiber route are approved as part of the transformer build.
- IF-C Multi-Channel Fiber Optic Temperature Transmitter. Host for separately selected probes, with 1 to 64 configurable channels, sampling interval under 1 s, dual RS485 with Modbus, optional 4-20 mA or 0-20 mA outputs, two alarm relays (5 A / 250 VAC) and 0 to 20 m of fiber per channel.
- Oil-Immersed Transformer Fiber Optic Temperature Monitoring System. Configured system combining probes, optical routing path, host and agreed alarm or communication functions. Listed at 1 to 18 customizable channels, AC/DC 220 V power supply and RS485 / Modbus with optional 4-20 mA output. Flanges, penetrators and protective covers are selected per project.
The chain runs probe, then fiber and tank penetrator, then host, then Modbus and relay outputs, then SCADA and alarms. Validation and trending need timestamped data from several defined points, which a multi-channel host with Modbus output and alarm contacts provides. The stainless-steel fiber optic penetrator and the flange plate (listed for fixing 1 to 16 penetrators) complete the optical path through the tank wall. Probe positions come from the thermal design, and the channel count follows the point list.
Information that speeds up a configuration review
- Transformer type, rating and winding arrangement
- Expected hot-spot regions from the thermal design
- Number of measurement points and channels
- Fiber route and length, plus host location
- Modbus, relay and analog output requirements
Need Help Planning Direct Winding Temperature Measurement?
Send the transformer type, rating, winding arrangement, expected hot-spot regions, number of measurement points, fiber route and communication requirements. INNO engineers can match the probe structure, fiber route and host channels to the project.
Related Transformer Temperature Monitoring Products
- Oil-Immersed Transformer Winding Fiber Optic Temperature Sensor: Direct point measurement at selected internal winding locations.
- IF-C Multi-Channel Fiber Optic Temperature Transmitter: Converts optical signals from separate probes into temperature data, alarms and Modbus output.
- Oil-Immersed Transformer Fiber Optic Temperature Monitoring System: Configured probes, routing components and host for oil-immersed projects.
Related Transformer Temperature Monitoring Guides
- What Causes Hot Spots in Transformers and How Are They Monitored?
- Transformer Winding Temperature Indicator vs Fiber Optic Temperature Sensor
- How Is Transformer Winding Temperature Measured?
- Where Are Fiber Optic Temperature Sensors Placed in Transformer Windings?
- How Many Fiber Optic Temperature Sensors for Transformer Windings?
References
- IEC. IEC 60076-7:2018, Power transformers – Part 7: Loading guide for mineral-oil-immersed power transformers. Edition 2.0. International Electrotechnical Commission, 2018.
- Cao, S. (2026). Online power-transformer hot-spot estimation via spectrum-aware physics-data hybrid learning. Discover Artificial Intelligence, 6, 1673. DOI: 10.1007/s44163-026-02632-y.
- Abdali, A., Abedi, A., Mazlumi, K., Rabiee, A., & Guerrero, J. M. (2023). Novel hotspot temperature prediction of oil-immersed distribution transformers: An experimental case study. IEEE Transactions on Industrial Electronics, 70(7), 7310–7322. DOI: 10.1109/TIE.2022.3206690.
- Abdali, A., Abedi, A., Masoumkhani, H., Mazlumi, K., Rabiee, A., & Guerrero, J. M. (2023). Magnetic-thermal analysis of distribution transformer: Validation via optical fiber sensors and thermography. International Journal of Electrical Power & Energy Systems, 153, 109346. DOI: 10.1016/j.ijepes.2023.109346.
- González-Cagigal, M. A., Rosendo-Macías, J. A., & Gómez-Expósito, A. (2023). Parameter estimation for hot-spot thermal model of power transformers using unscented Kalman filters. Journal of Modern Power Systems and Clean Energy, 11(2), 634–642. DOI: 10.35833/MPCE.2022.000439.