
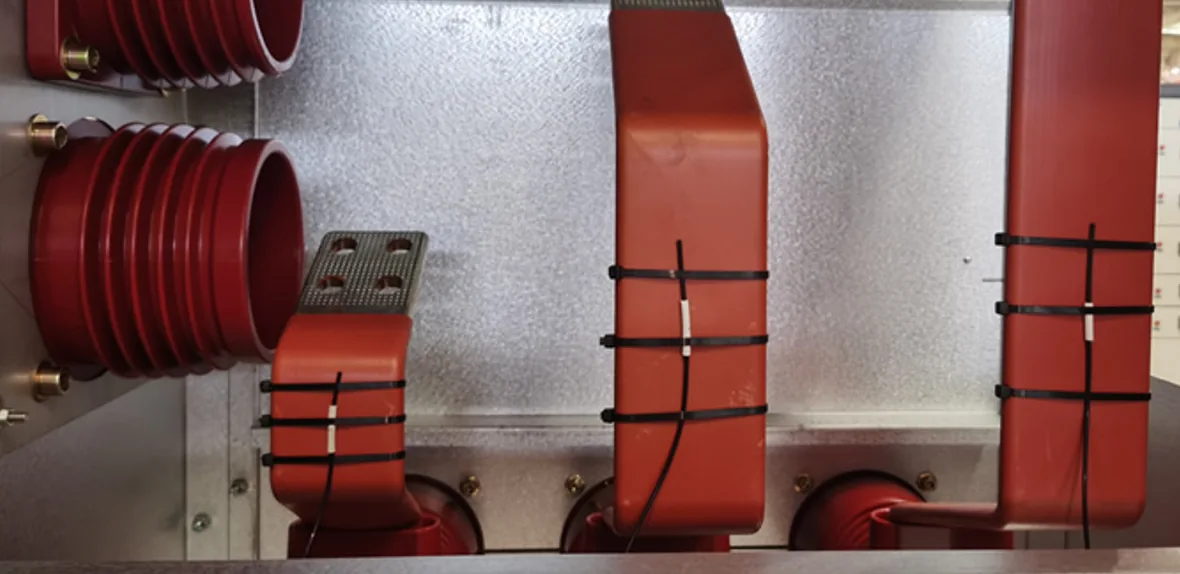
- Busbar hot spots most often appear at joints, bolted connections and other high-current connection points, rather than along the conductor itself.
- Abnormal contact resistance at a connection can produce localized heating, especially under sustained or fluctuating load.
- Temperature trends over time help reveal developing connection problems, particularly when read together with load current and equipment condition.
- Infrared inspection, wireless or contact sensors and fiber optic sensing each suit different installation conditions, and none is the best choice everywhere.
- Fluorescence fiber optic sensing fits high-voltage, high-current and strong-EMI environments where a defined point must be measured with an electrically isolated sensing path.
Busbar temperature monitoring is the practice of measuring temperature at selected busbar locations, mainly joints and bolted connections, so that abnormal heating can be recognized before it becomes a reliability problem. A busbar can carry large current for years without trouble. The weak points are the places where one conductor meets another, and those are where temperature data is most informative.
Why Busbar Joints and Bolted Connections Become Hot Spots
Heat generated in a conductor scales with resistance and the square of the current. A continuous busbar section has low, predictable resistance. A joint adds a contact interface, and the real contact area there is much smaller than the visible overlap of the two surfaces. If that interface is not in good condition, resistance rises and heat concentrates in a small volume.
Several conditions can contribute:
- Loose or degraded connections. Bolt preload can relax over time, reducing contact pressure and increasing contact resistance.
- Thermal cycling. Repeated heating and cooling expands and contracts the joint materials, which can gradually change clamping force.
- Oxidation or contamination. Films or debris on contact surfaces can raise resistance where surface preparation or sealing was inadequate.
- Uneven current distribution. Parallel conductors or complex geometries may not share current equally, loading some connections more than others.
- Sustained high current or abnormal loading. Operation near or above design load raises the temperature of every connection, good or bad.
- Poor connection quality. Mismatched surfaces, incorrect torque or incomplete assembly can create a weak joint from the start.
A temperature rise does not by itself identify which of these is responsible. A joint running warm under heavy load may be perfectly healthy, while the same reading at light load may point to a problem. Temperature data is most useful when combined with load current, visual and electrical inspection results and maintenance history.
Where Busbar Temperature Should Be Monitored
Measurement points should follow the physical structure of the equipment and its realistic risk points, not a fixed count. Typical candidates include:
- Bolted joints between busbar sections
- Busbar-to-busbar and busbar-to-terminal connections
- Cable-to-bus connections
- Busbar sections inside switchgear compartments
- Other high-current connection points where heating has occurred before or access is limited
In enclosed equipment, inspection access is often restricted, which makes continuous measurement at selected connections valuable. This is the situation addressed by switchgear temperature monitoring, where a few well-chosen points can say more than occasional manual checks.
Comparing Busbar Temperature Monitoring Methods
The right method depends on access, voltage level, electromagnetic environment and how often data is needed. Fiber optic sensing is not required for every busbar application. Infrared inspection, conventional contact sensors or wireless sensors may already satisfy the measurement requirement in suitable installations.
| Method | Where it fits | Points to consider |
|---|---|---|
| Infrared / thermal imaging | Periodic inspection of visible surfaces; scanning many components quickly | Needs line of sight; readings depend on surface emissivity; not continuous unless fixed cameras are used |
| Conventional contact sensors | Many ordinary locations with straightforward wiring | In high-voltage or strong-EMI areas, insulation, lead routing and installation must be considered |
| Wireless temperature sensors | Some online monitoring applications where cabling is difficult | Power supply method, communication environment inside metal enclosures, mounting structure and long-term maintenance |
| Fluorescence fiber optic point sensors | Defined contact points requiring electrical isolation and high resistance to electromagnetic interference | Probes must be planned and installed at specific points; each point needs its own probe and channel |
Infrared is well suited to inspection rounds because one instrument can survey many connections, but it only sees what it can see, and enclosed busbars are often hidden. Contact and wireless sensors place the measurement on the connection itself, which brings the sensor into a harsh electrical environment. A broader comparison of point and non-contact temperature measurement covers the trade-offs in more detail.
What Temperature Trends Can Show
Absolute temperature is only part of the picture. Trends often carry more diagnostic value, and they do not require a fixed alarm figure to be useful. Patterns worth watching include:
- Gradual rise at constant load. A slow upward drift without a matching change in current may indicate a connection that is deteriorating.
- Load-related changes. Temperature that follows current closely is expected behavior; the question is whether the rise is proportionate.
- Difference between comparable connections. Similar joints carrying similar current should run at similar temperatures, so a persistent gap deserves attention.
- Sudden temperature change. A rapid step that is not explained by load or ambient conditions calls for inspection.
- Repeated overheating patterns. Recurrent excursions at the same location suggest an underlying issue rather than a one-off event.
Alarm settings should come from the equipment manufacturer, applicable standards and the operator's own maintenance practice, not from a generic number. Trend data supports these decisions; it does not replace inspection.
Point Measurement with Fluorescence Fiber Optic Sensing
INNO's approach is fluorescence-based point fiber optic temperature sensing. The principle is easy to state precisely: one probe measures one defined physical point. Monitoring several connections means installing several probes and using corresponding channels.
This is not distributed temperature sensing (DTS), and it does not measure continuously along the length of the fiber. It also does not search for unknown hot spots. The probe must be installed at a planned measurement point, which means the engineering work of choosing those points matters as much as the sensor itself. A dedicated busbar and bolted connection fiber optic temperature probe can measure temperature directly at that planned connection point.
How the Fluorescence Principle Works
The measurement chain is short:
excitation light → fluorescent sensing material → returned fluorescence → decay waveform → fluorescence lifetime → calibration → temperature
The instrument sends excitation light through the optical fiber to a fluorescent material at the probe tip. The material emits fluorescence whose decay time depends on temperature. The instrument analyzes the decay waveform, extracts the lifetime and converts it to temperature using a calibration relationship. Because the reading comes from decay time rather than light intensity, it is less sensitive to fiber bending or connector losses. Further detail on the technique is available under fluorescence fiber optic temperature sensing.
Because the sensing path is optical, it is electrically isolated from the conductor, and it offers high resistance to electromagnetic interference. This matters near high-current busbars, where strong fields can disturb electrical signals. The topic is examined further in temperature measurement in strong electromagnetic fields.
Typical Specifications
Typical values depend on probe and monitoring-system configuration.
| Parameter | Typical value |
|---|---|
| Measurement principle | Fluorescence decay time |
| Temperature range | −40 °C to +260 °C |
| Accuracy | ±0.5 °C to ±1 °C depending on configuration |
| Resolution | 0.1 °C |
| Response | <1 s for standard configurations |
| Probe diameter | 2–3 mm, configurable |
| Fiber length | Configurable according to application requirements |
| Electrical insulation | >100 kV for applicable configurations |
| Connector | ST |
| Channels | Single-channel and multi-channel configurations |
| Communication | RS485 / Modbus RTU for applicable instruments |
These characteristics suit high-voltage temperature monitoring, where insulation between the sensing point and the instrument is a basic requirement, and the broader category of high-voltage equipment temperature monitoring.
Multi-Point Online Busbar Temperature Monitoring
Busbar assemblies often contain several joints or connection points, so multi-channel monitoring may be used when several defined locations need continuous measurement. Channel count follows the actual measurement points, which in turn follow the equipment layout and risk assessment. Several joints can be connected through multi-point temperature monitoring when each point has its own sensor and channel.
A typical architecture looks like this:
fiber optic probe → optical fiber → temperature transmitter / demodulator → temperature data → RS485 / Modbus RTU where applicable → PLC / SCADA / monitoring system
A multi-channel fiber optic temperature transmitter handles the optical measurement and outputs temperature data, which the plant's existing PLC, SCADA or monitoring platform then uses for display, trending and alarming. INNO supplies the sensing and measurement layer; the supervisory system remains the user's. For switchgear, a packaged switchgear fiber optic temperature monitoring system combines these elements, and the wider range of fiber optic temperature monitoring systems covers other configurations. The underlying fiber optic temperature sensors and fiber optic temperature measurement approach are common across these applications.
Choosing the Right Busbar Temperature Monitoring Method
The measurement method should follow the physical connection point and its electrical environment. Where surfaces are visible and inspection rounds are acceptable, infrared may be enough. Where continuous data is needed at enclosed or energized connections, contact, wireless or fiber optic sensors each have a place, depending on voltage level, EMI conditions and maintenance expectations.
Temperature trends are more useful when considered together with load current and equipment condition, and fiber optic point sensing is especially relevant where electrical isolation and strong EMI resistance matter. Multi-point systems require one probe per defined point, so the measurement plan should be settled before installation. Questions about a specific busbar layout can be discussed with the INNO engineering team.